Mini Analysis Plugin
The purpose of this plugin is to detect, analyze, and annotate mini synaptic events.
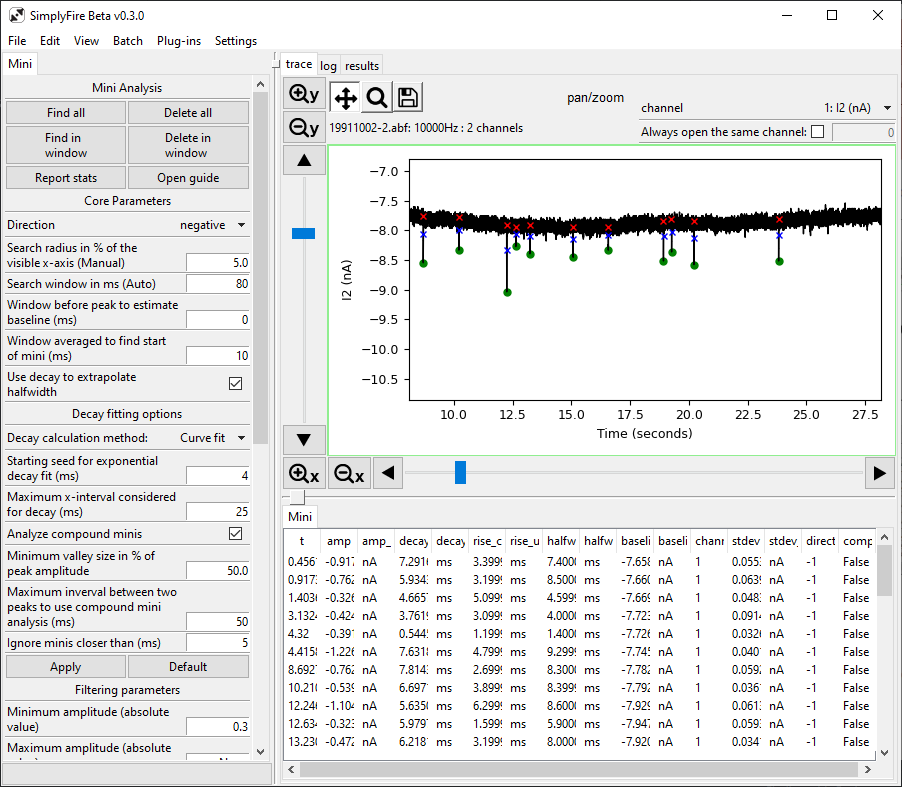
A typical layout of the Mini Analysis Plugin.
- Requirements
View mode must be
continuous
Tab title: Mini
Core Parameters
- Direction
Indicates the expected sign of the minis. Typically, the direction is positive for potential and negative for current recordings.
- Search radius in % of the visible x-axis (Manual)
Used for manual mini analysis. Indicates the x-axis radius that is considered for analysis when the mouse is clicked. The radius is represented as a percentage of the total x-axis. In general, the lower number in this parameter, the higher the precision of the mouse-click.
- Search window in ms (Auto)
Used for automated mini analysis. Indicates the window of x-axis that is considered at a time. The window traverses from left to right, sampling the specified window at a time. In general, the lower number in this parameter, the fewer minis are skipped but also the slower the analysis.
Caution
The x-axis window considered for each mini analysis must be larger than at least of 20 data points worth of x-axis range (i.e. for a 10kHz recording, the window must be larger than 2ms) Ideally, each mini analysis covers at least the approximate width of a single mini event.
- Window before peak to estimate baseline (ms)
The baseline is calculated by averaging data points. Setting this value >0 fixes where the data points are sampled in relation to the peak time to calculate the baseline. The value specifies the left most (earliest) data point to sample for baseline calculation.
Set this parameter to 0 to ignore the parameter and use the trailing-moving-average.
- Window averaged to find start of mini (ms)
The baseline is calculated by averaging data points. This parameter sets the size of the x-axis window that should be sampled to calculate the average. Higher numbers tend to result in increased robustness against consistent baseline noise; however, higher numbers can result in effects of unusually large and rapid deviations from the baseline (i.e. artefacts) affecting the surrounding mini baseline calculations.
- Use decay to extrapolate halfwidth
If a mini does not decay below 50% of the amplitude, halfwidth cannot be calculated. Checking this option allows SimplyFire to estimate the halfwidth using the decay properties.
- Minimum valley size in % of peak amplitude
Input available if analyzing compound minis. Enter a percentage of the maximum amplitude that must be reached during the decay phase before the next mini.
- Ignore minis closer than (ms)
Input available if analyzing compound minis. Enter the radius around the peak that should be ignored while searching for compound minis. Increase this value if the automated analysis is picking up noise around the peak.
- Decay calculation method
Two algorithms are available to estimate the decay constant (tau):
Curve fitor% amplitudeCurve fituses thescipypackage to fit a single exponential to the raw data.% amplitudeuses the first data point that reaches a certain percentage of the maximum amplitude after the peak to estimate the decay constant.- Starting seed for exponential decay fit (ms)
Input available for
Curve fitalgorithm. Enter the ‘best guess’ for the decay constant when fitting a single exponential to the decay phase of the mini. This parameter is passed to the scipy.optimize.curve_fit function.- Percent peak to mark as decay constant (%)
Input available for
% amplitudealgorithm. Enter the percentage value used to estimate the decay constant. Enter 37 to estimate the decay constant for a single exponential function.- Maximum x-interval considered for decay (ms)
Input available for
Curve fitand% amplitudealgorithms. Enter the maximum range of data points that should be sampled to calculate the decay constant.- Analyze compound minis
Select this checkbox to analyze compound minis
- Maximum interval between two peaks to use compound mini analysis (ms)
Input available if analyzing compound minis. Enter the maximum range between two minis that should use compound mini analysis.
- Apply button
Apply the parameters for future analysis.
- Default button
Sets the core input parameters to default values.
Filtering parameters
Minimum and maximum values can be set for the following parameters.
Setting these values before analyzing minis will reject any candidate
minis that do not meet the parameters.
Previously found minis can be filtered by setting the parameters and clicking
on Apply filter (all) or Apply filter (window).
Minimum values set to 0 and maximum values set to None will be ignored.
- amplitude (absolute value)
Specify the minimum/maximum amplitude required for a mini. Use absolute value (unsigned). Setting this to 0 (without other filtering parameters) will result in most noise being annotated as a mini.
- decay constant (tau) (ms)
Specify the minimum/maximum decay constant required for a mini in ms.
- halfwidth (ms)
Specify the minimum/maximum halfwidth required for a mini in ms. Halfwidth is calculated as the minimum time between data points at 50% of the maximum amplitude during the rise and decay phases.
- rise constant (ms)
Specify the minimum/maximum rise time required for a mini in ms. Rise is calculated from the start of the mini (0% amplitude) and the peak (100% amplitude).
- decay/rise ratio
Specify the minimum/maximum ratio between decay and rise for a mini.
- signal-to-noise ratio
Specify the minimum/maximum ratio between baseline noise standard deviation and the maximum amplitude or the mini. Baseline noise is defined as the standard deviation of the data points sampled in estimating the baseline.
- Confirm button
Sets the filtering parameters for future analysis. This does not affect previously found minis.
- Default
Sets the filtering parameters to default values. This does not affect previously found minis.
- Apply filter (all) button
Applies the filtering parameters to all previously found minis. Any minis that do not meet the criteria are discarded.
- Apply filter (window)
Applies the filtering parameters to previously found minis in the visible x-axis. Any minis within the visible x-axis that do not meet the criteria are discarded.
Data-panel display columns
Toggle the checkboxes to change the visibility of columns in the data-panel.
- Show all button
Sets all columns in the data-panel to ‘show’.
- Hide all button
Hides all columns in the data-panel.
Style setting
The markers on the plot for minis can be altered in the Style Plugin control-panel.
The size and color of the following markers can be changed.
Size should be an integer.
Color should be a hex code or a color name accepted by matplotlib.
See the matplotlib documentation
for more details on supported color names.
- Peak
Marks the data point in the mini with the maximum amplitude as a dot.
- Start
Marks the data point at the start of the mini with ‘x’.
- Decay
Marks where t=decay constant with ‘x’. Depending on the decay algorithm chosen, the point may or may not be an actual data point in the recording.
- Highlight
Marks only the selected minis with a dot. Minis can be selected by clicking on existing peak markers or by left-click + drag.
- Apply button
Apply the stylistic parameters
- Default button
Sets the input parameters to default values
Mini guide
Sometimes it can be unclear why a mini was chosen or why the parameters look different from what was expected. The mini guide attempts to clear such questions by providing a detailed report of a given mini.
Click the Open guide button to open a popup.
Triggering a manual analysis or selecting a single mini will plot the
same mini in the popup window.
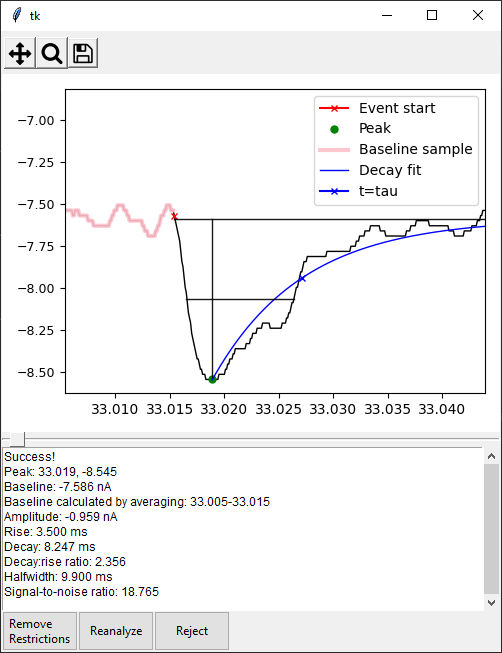
An example mEJC shown in the mini guide
- In the plot area, the following details are plotted:
Raw data points including and around the mini
The data point representing the start of mini
The data point representing the peak
Data points sampled to calculate the baseline
Single exponential decay function fitted to the decay phase
A point within the decay function where t = decay constant
A line plotting the baseline (a single y-value for a regular mini, extrapolated decay from previous mini for compound minis)
A line representing the amplitude
A line connecting the two data points used to calculate the halfwidth
- In the text box below the plot, the following details can be found:
Whether or not there was a mini in the region
Peak data point
Baseline value
x-axis limits used to calculate the baseline
Amplitude
Rise constant (0-100)
Decay (tau)
Decay/rise ratio
Halfwidth
Signal-to-noise ratio
Tip
If no mini is discovered with manual analysis, the reason for the failure will be available in the text box. Adjusting the parameters or easing the filtering criteria may help detect the mini
- Remove Restrictions button
Clicking this button when a manual analysis fails to detect a mini re-analyzes the region but without any of the filtering parameters.
- Reanalyze button
Clicking this button when a manual analysis fails to detect a mini re-analyzes the region with the parameters set in the control-panel. Use this button to reanalyze minis after changing parameters.
- Reject button
Clicking this button when a mini is highlighted discards the mini from the data.
Data-panel
Every mini marked in the trace plot is also annotated in the data-panel.
An entry can be selected by left click
Multiple entries can be selected by left click + Shift or left click + Ctrl. Selecting entries in the data-panel also highlights minis in the trace plot, adjusting the x- and y-axes so that all the selected minis are visible. Conversely, minis selected from the trace plot are also selected in the data-panel.
Pressing Delete/Backspace/e deletes the entries in the data-panel and associated mini markers on the trace.
Mini data are cleared when a new recording is opened.